Overview
The latest interactive plotting tool is making waves for its impressive functionality and user-friendly design. It specializes in visualizing data with features that cater to both novice users and seasoned developers alike. With its intuitive controls and customizable options, you can visualize your data seamlessly, making it a fantastic addition to any data analysis workflow.
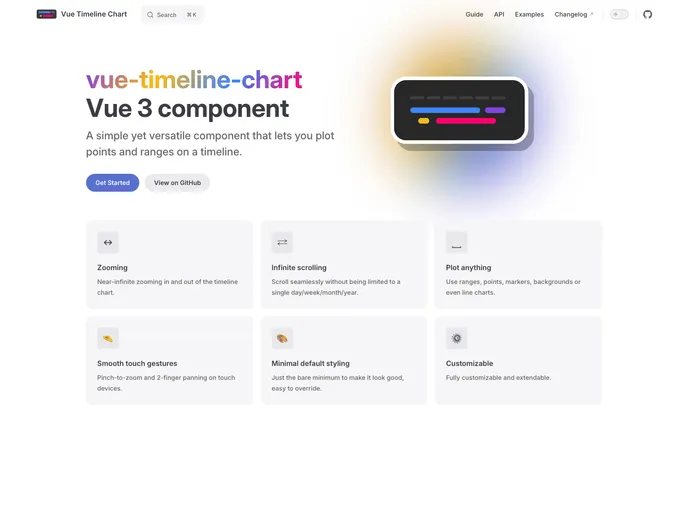
Features
- Zooming: Effortlessly zoom in and out of your plots to focus on areas of interest.
- Infinite Scrolling: Enjoy smooth, native horizontal scroll events to navigate your data easily; hold shift + scroll to change from vertical to horizontal scrolling.
- Plot Customization: Create detailed plots with ranges, points, markers, and background settings for comprehensive data visualization.
- Smooth Touch Gestures: Utilize pinch-to-zoom and up to two-finger panning for a fluid and interactive experience on touch devices.
- Adjustable Timestamp Labels: Tailor timestamp labels per scale for enhanced clarity and precision in your visualizations.
- Minimal Styling: Focus on your data presentation without distractions, thanks to a sleek and minimalistic design.
- Live Demo Availability: Check out a live demo to explore and interact with the plotting tool in real time.
- Extensive API Documentation: Access detailed examples and documentation to help you get started and make the most of your plotting tool.


