Overview
Vuepoint is an innovative dashboard framework built on Vue.js, designed to provide users with a streamlined and customizable way to visualize data. Its user-friendly interface and powerful features make it an excellent choice for anyone looking to build visually appealing dashboards that can effectively display various types of information, from simple metrics to more complex data visualizations.
With Vuepoint, users can easily integrate multiple components and display essential metrics in real-time, making it a versatile tool for developers and business analysts alike. Whether you’re tracking performance metrics or monitoring real-time data, Vuepoint provides a solid foundation to create engaging and informative dashboards.
Features
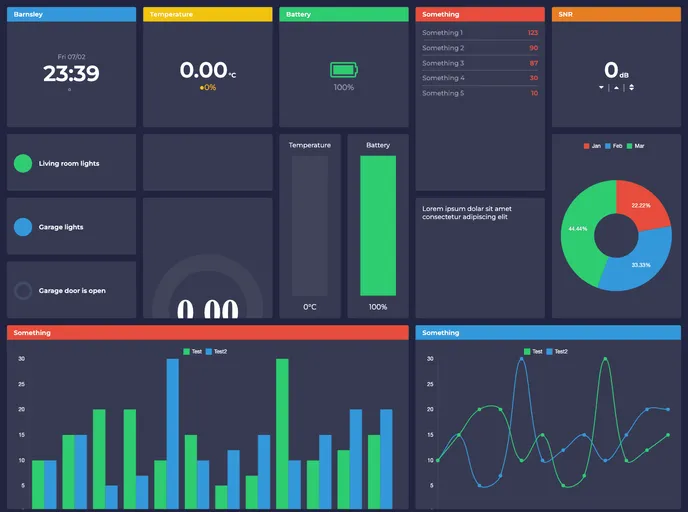
- Value Tile: Display simple numeric values alongside customizable before and after text for clarity.
- Text Tile: Show formatted text or HTML content, perfect for highlighting key messages or information.
- List Display: Present multiple label and value items in a clean and organized manner for easy comparison.
- Battery Indicator: A visual representation of battery levels, making it easy to monitor energy usage.
- Gauge Display: Offers a dynamic gauge for displaying metrics, giving users a quick visual reference.
- Chart Options: Includes versatile chart types such as line, bar, or doughnut for varied data representations.
- Weather Component: Provides local weather updates with temperature and icons, refreshed every 15 minutes.
- Animated Number: Adds engaging animations to number changes, enhancing user interaction and focus.
Vuepoint combines powerful functionality with an intuitive design, making it an ideal choice for building modern dashboards that cater to diverse data visualization needs.


